Ann Pregler
Blog
Portfolio
Contact
Portfolio
November 10, 2024
Wellerman
Continue reading
: Wellerman
Portfolio
November 10, 2024
Blank Spaces
Continue reading
: Blank Spaces
Portfolio
July 6, 2023
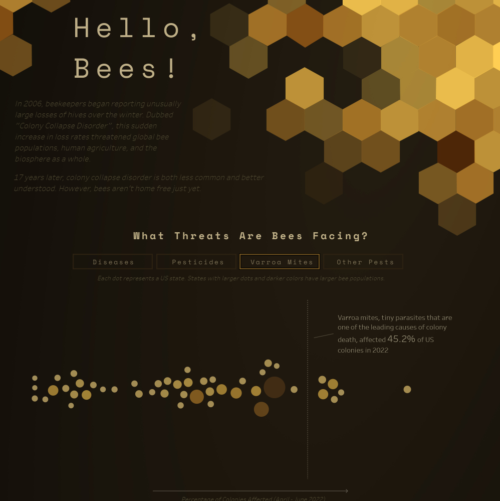
Bee Health (VotD)
Continue reading
: Bee Health (VotD)
Portfolio
January 25, 2023
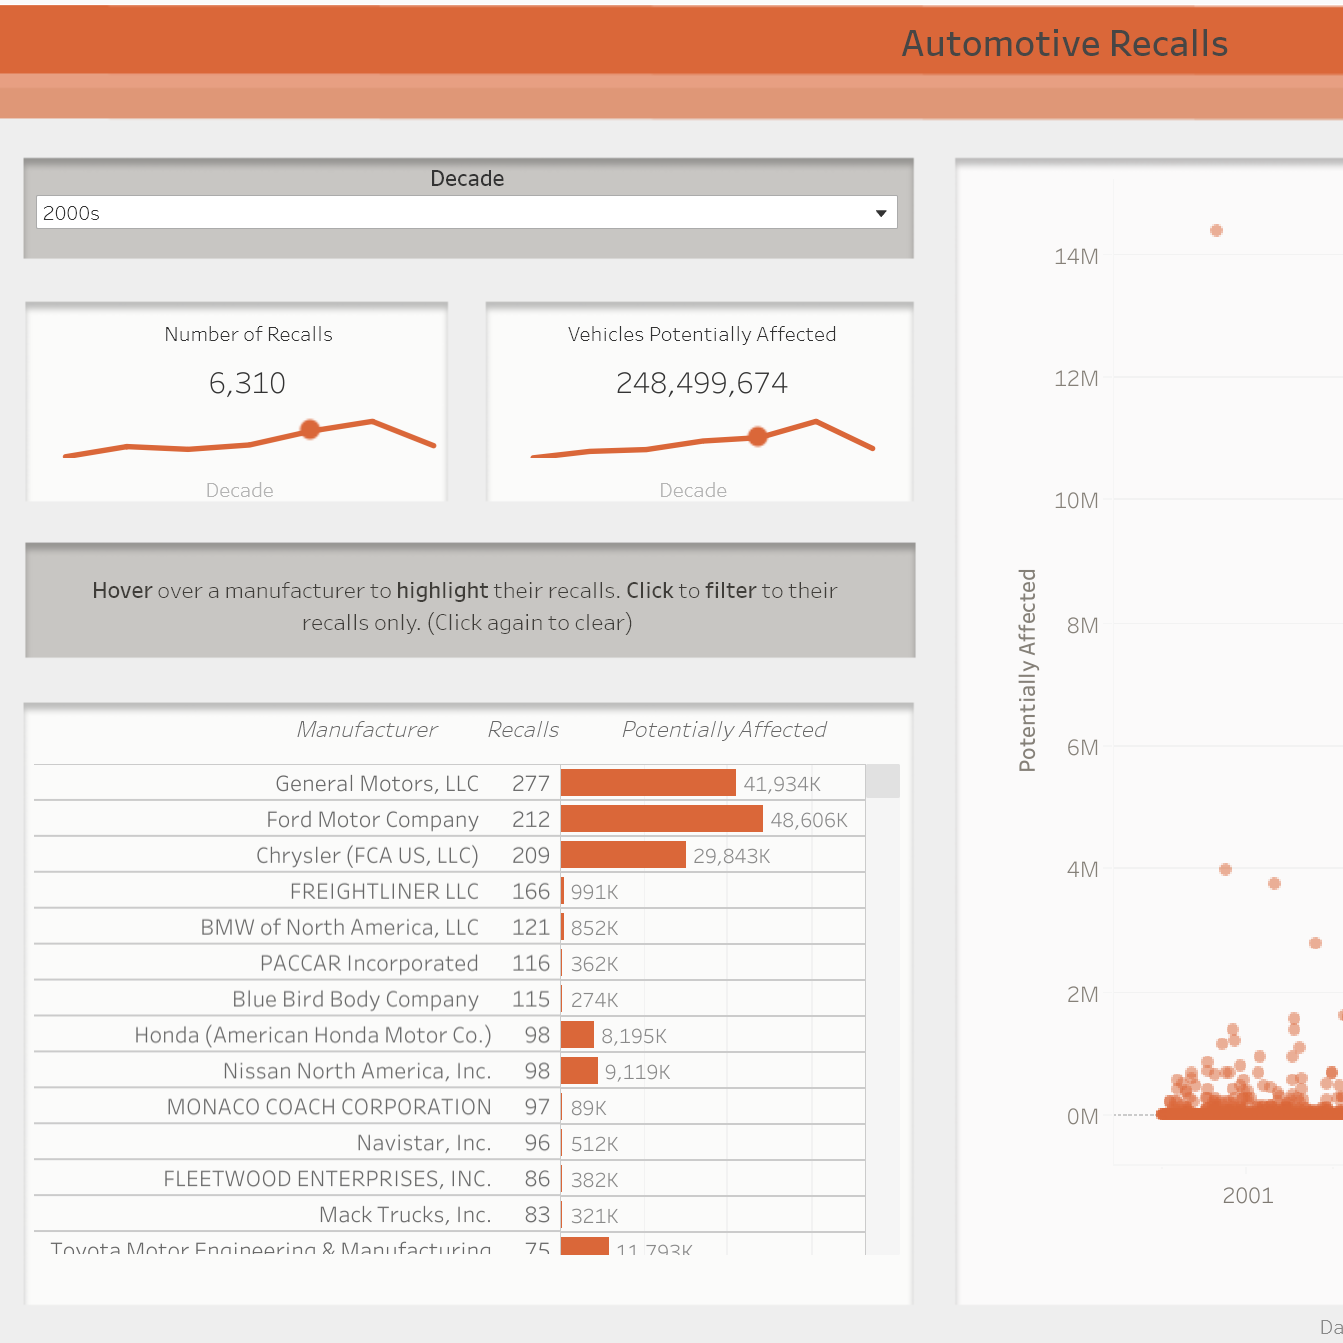
Auto Recalls
Continue reading
: Auto Recalls
Portfolio
January 25, 2023
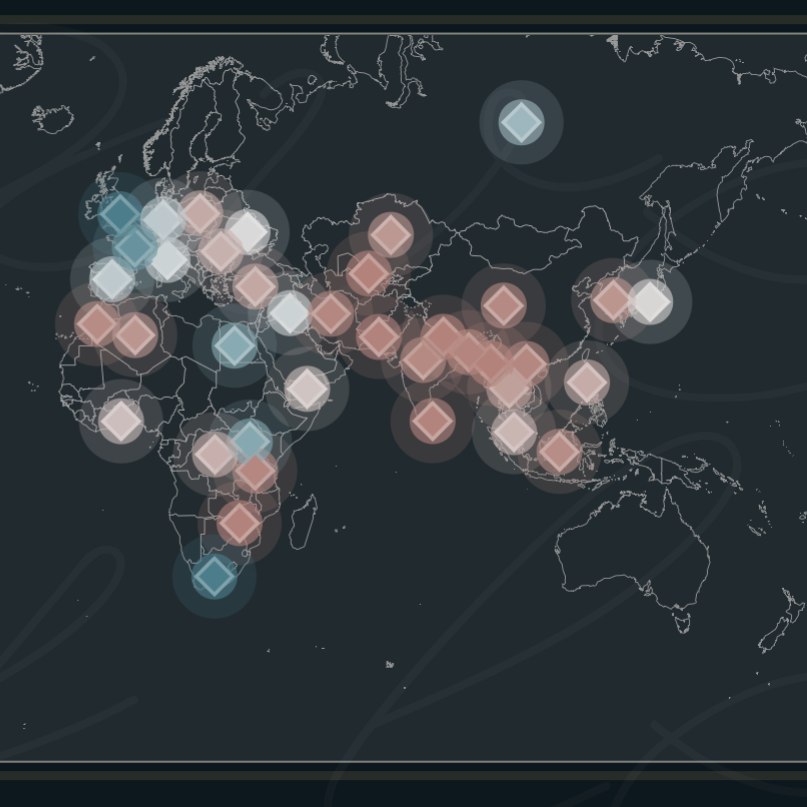
International Students
Continue reading
: International Students
Portfolio
January 1, 2023
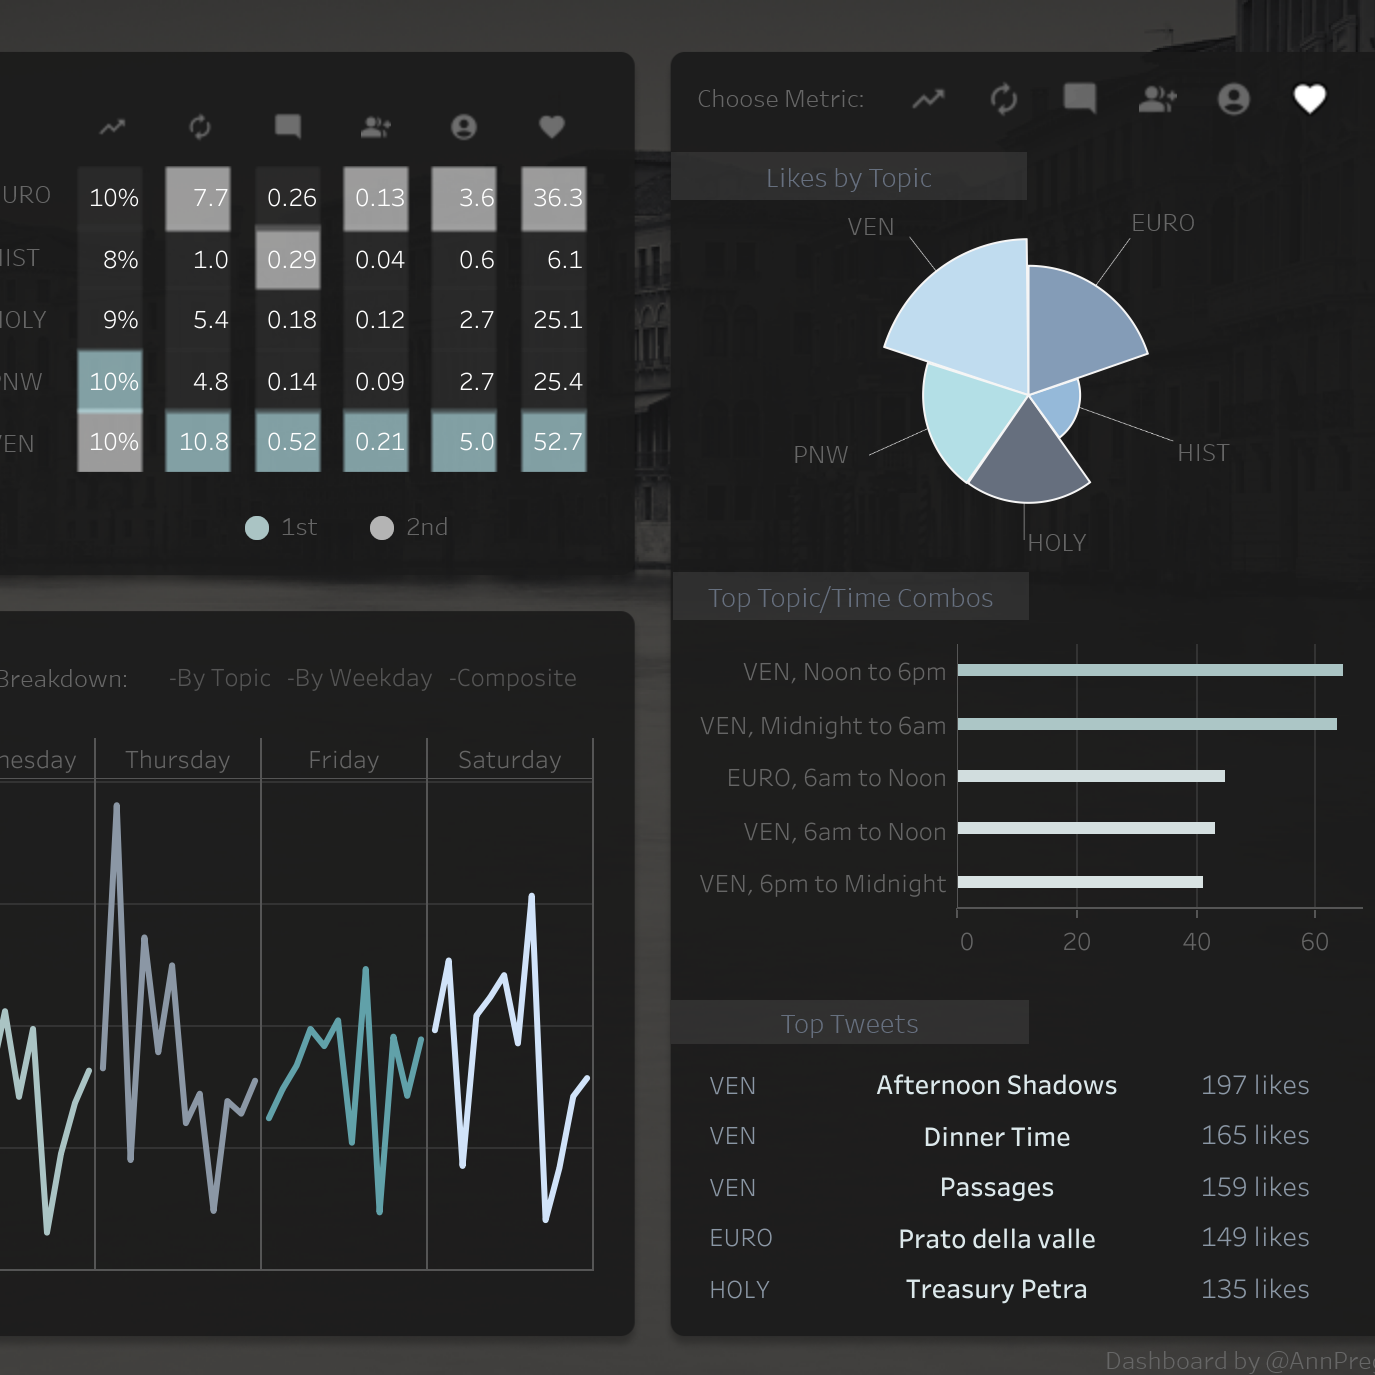
Twitter Metrics
Continue reading
: Twitter Metrics
Data Viz
,
Portfolio
January 1, 2023
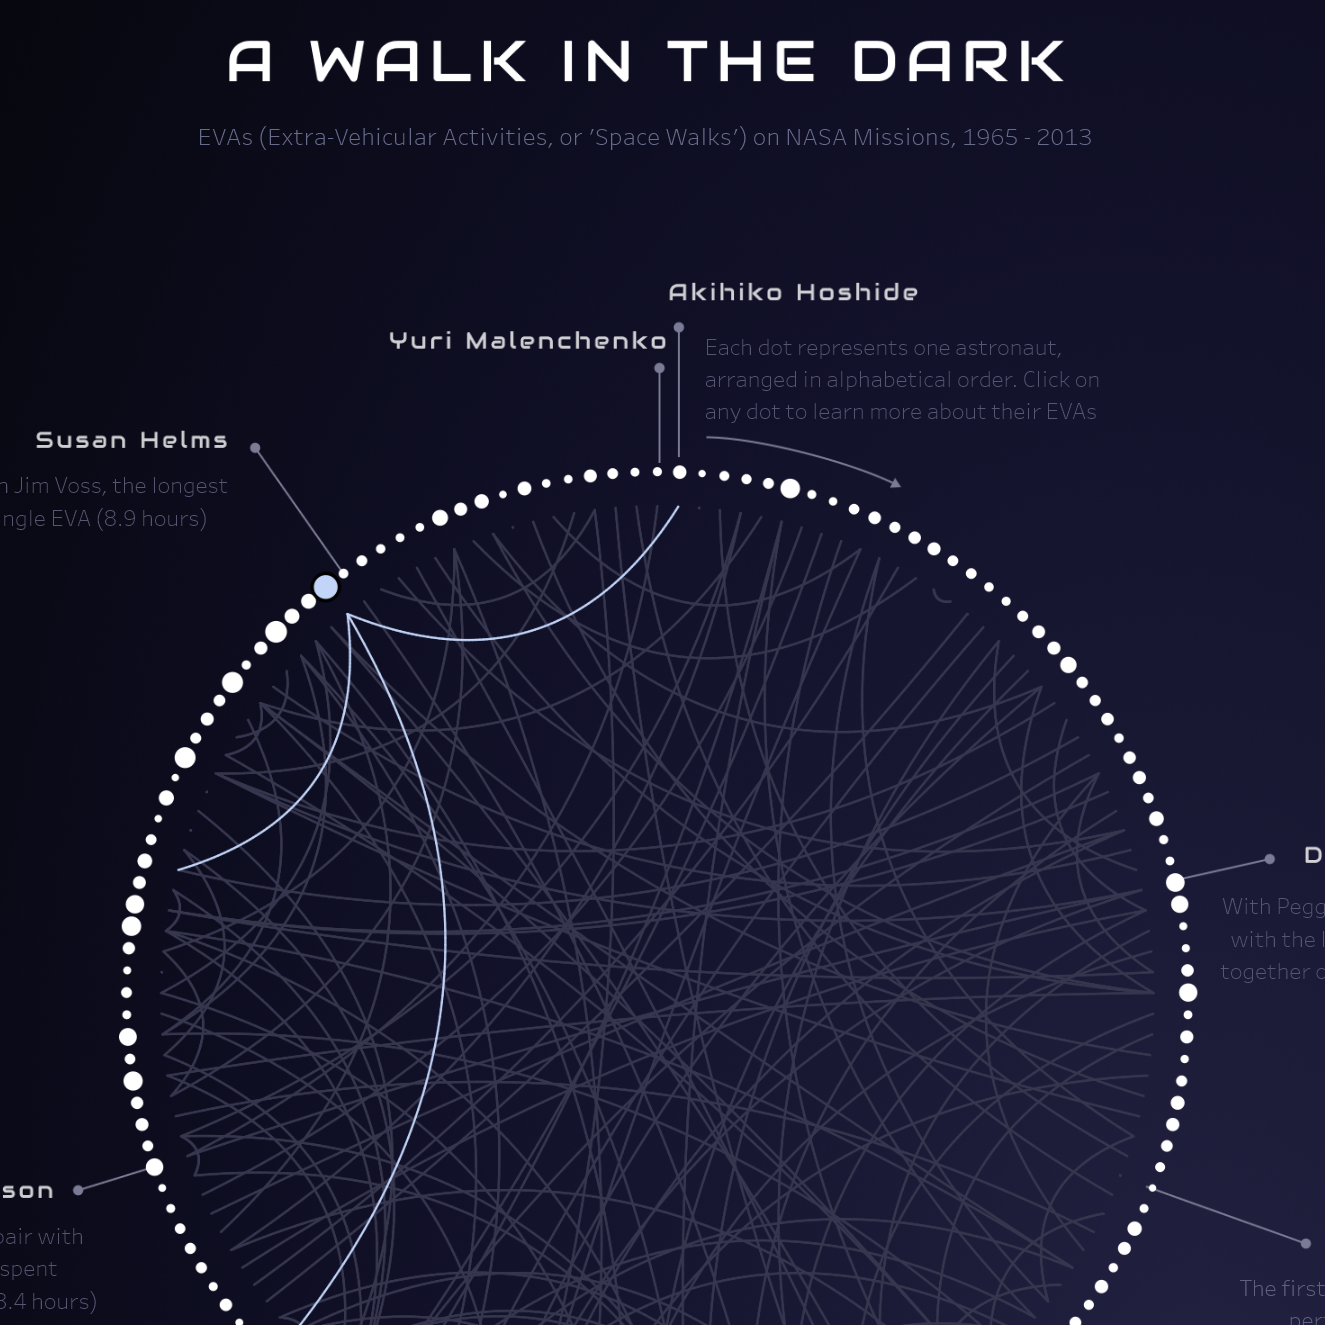
Space Walks
Continue reading
: Space Walks
K12
,
Portfolio
December 27, 2022
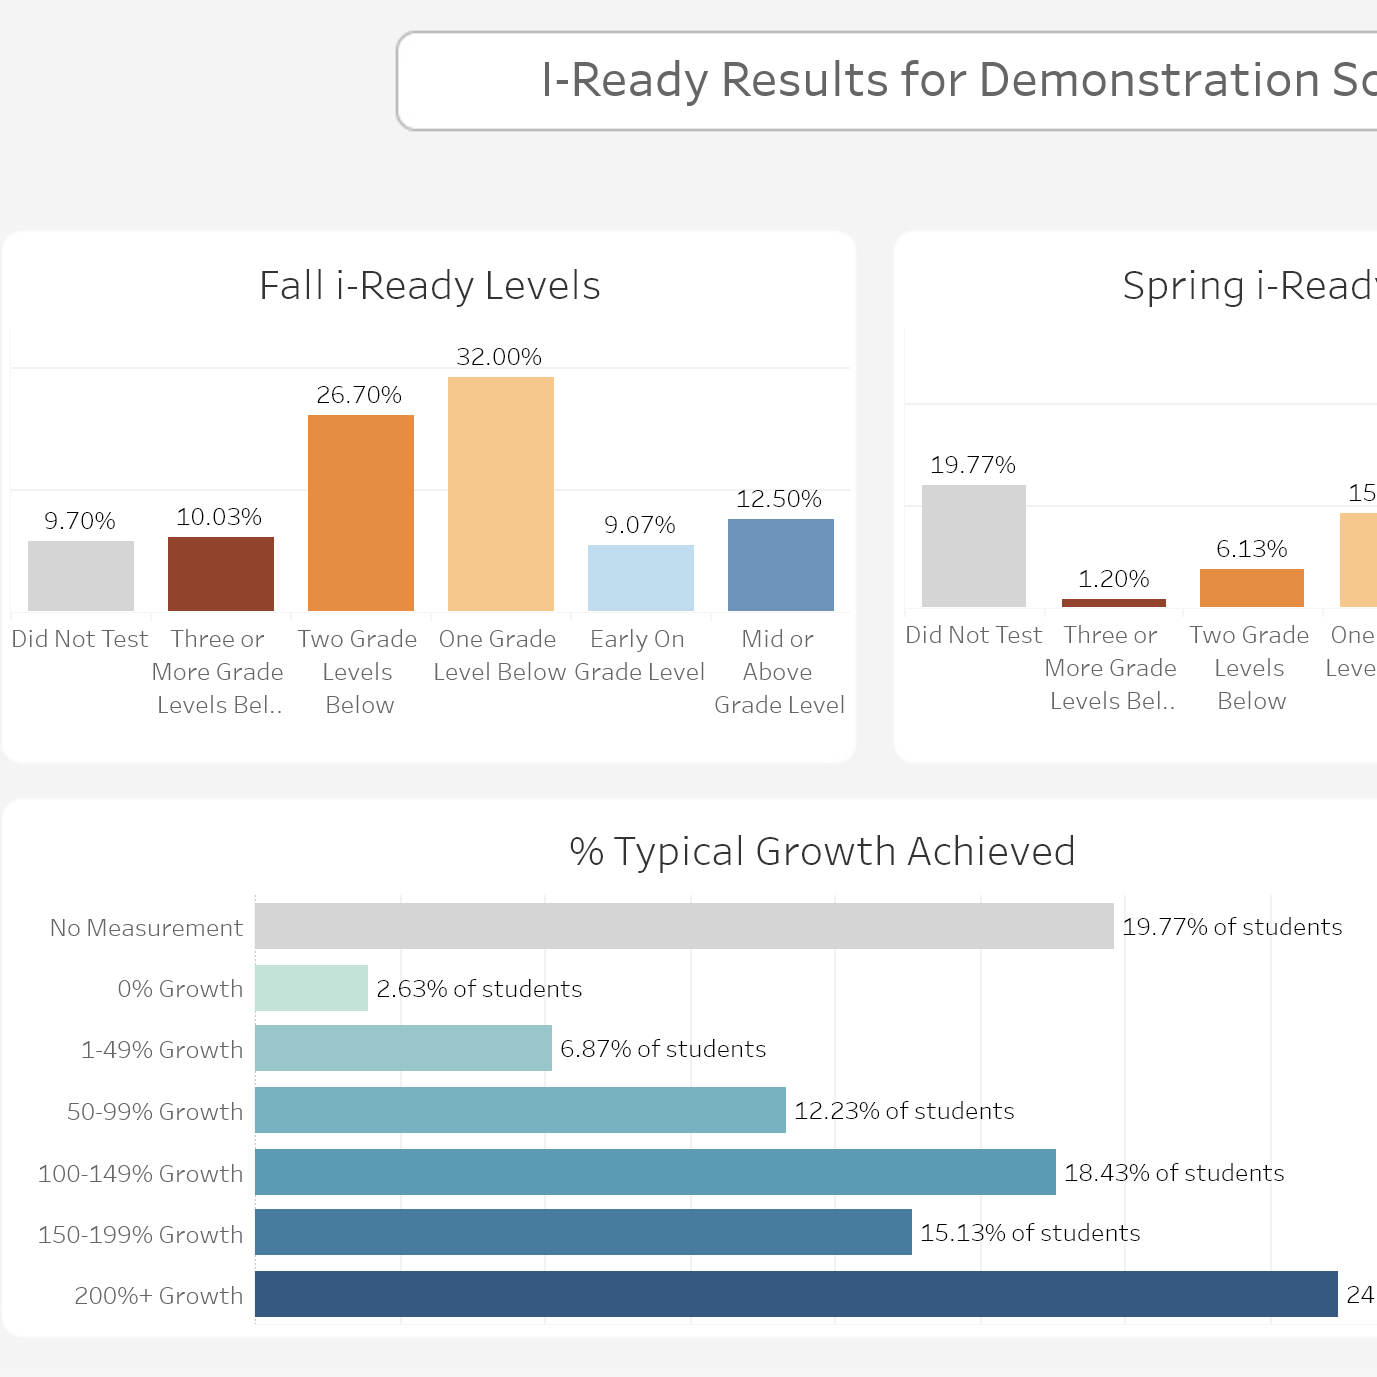
K12: Assessment Growth
Continue reading
: K12: Assessment Growth
K12
,
Portfolio
December 26, 2022
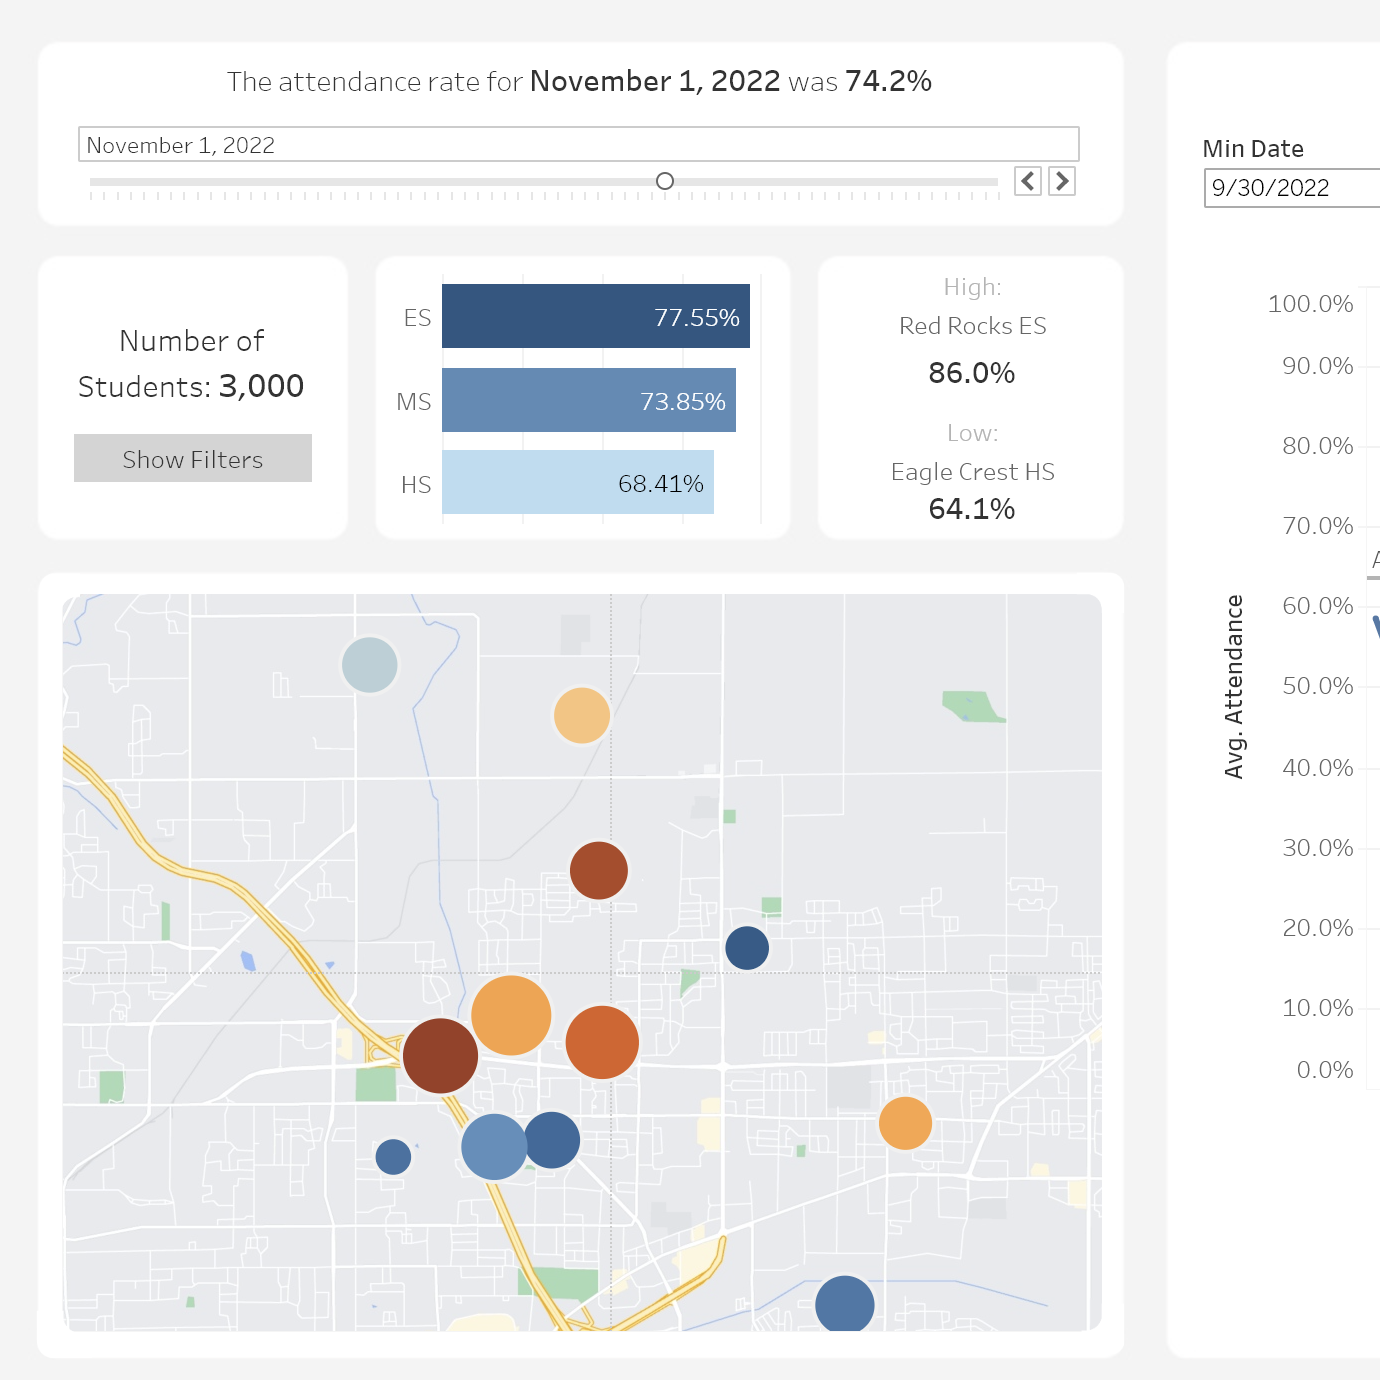
K12: Attendance
Continue reading
: K12: Attendance
Data Viz
,
Portfolio
December 26, 2022
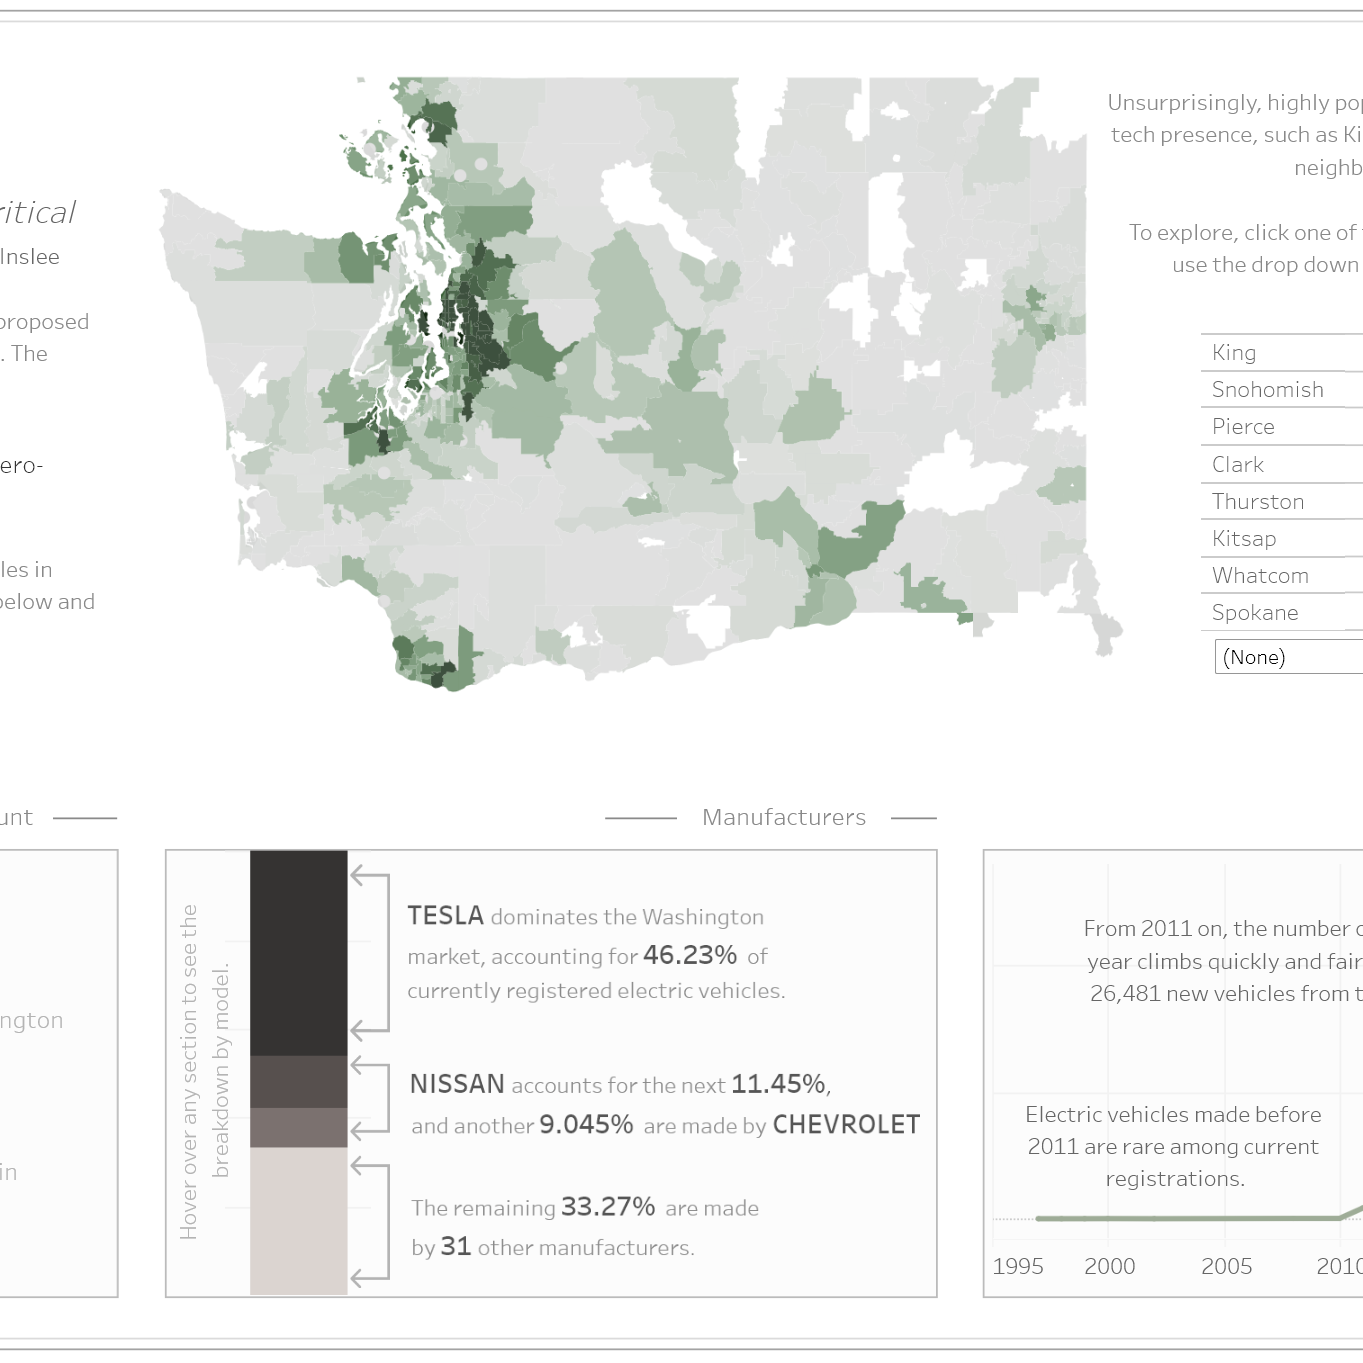
Electric Vehicles
Continue reading
: Electric Vehicles
1
2
Next Page
Notifications