Ann Pregler
Blog
Portfolio
Contact
Tableau
January 30, 2023
Tableau Certified Data Analyst Exam
Continue reading
: Tableau Certified Data Analyst Exam
Data Viz
,
Tableau
January 26, 2023
Level Up: Using Multiple Mark Layers in Tableau
Continue reading
: Level Up: Using Multiple Mark Layers in Tableau
Portfolio
January 25, 2023
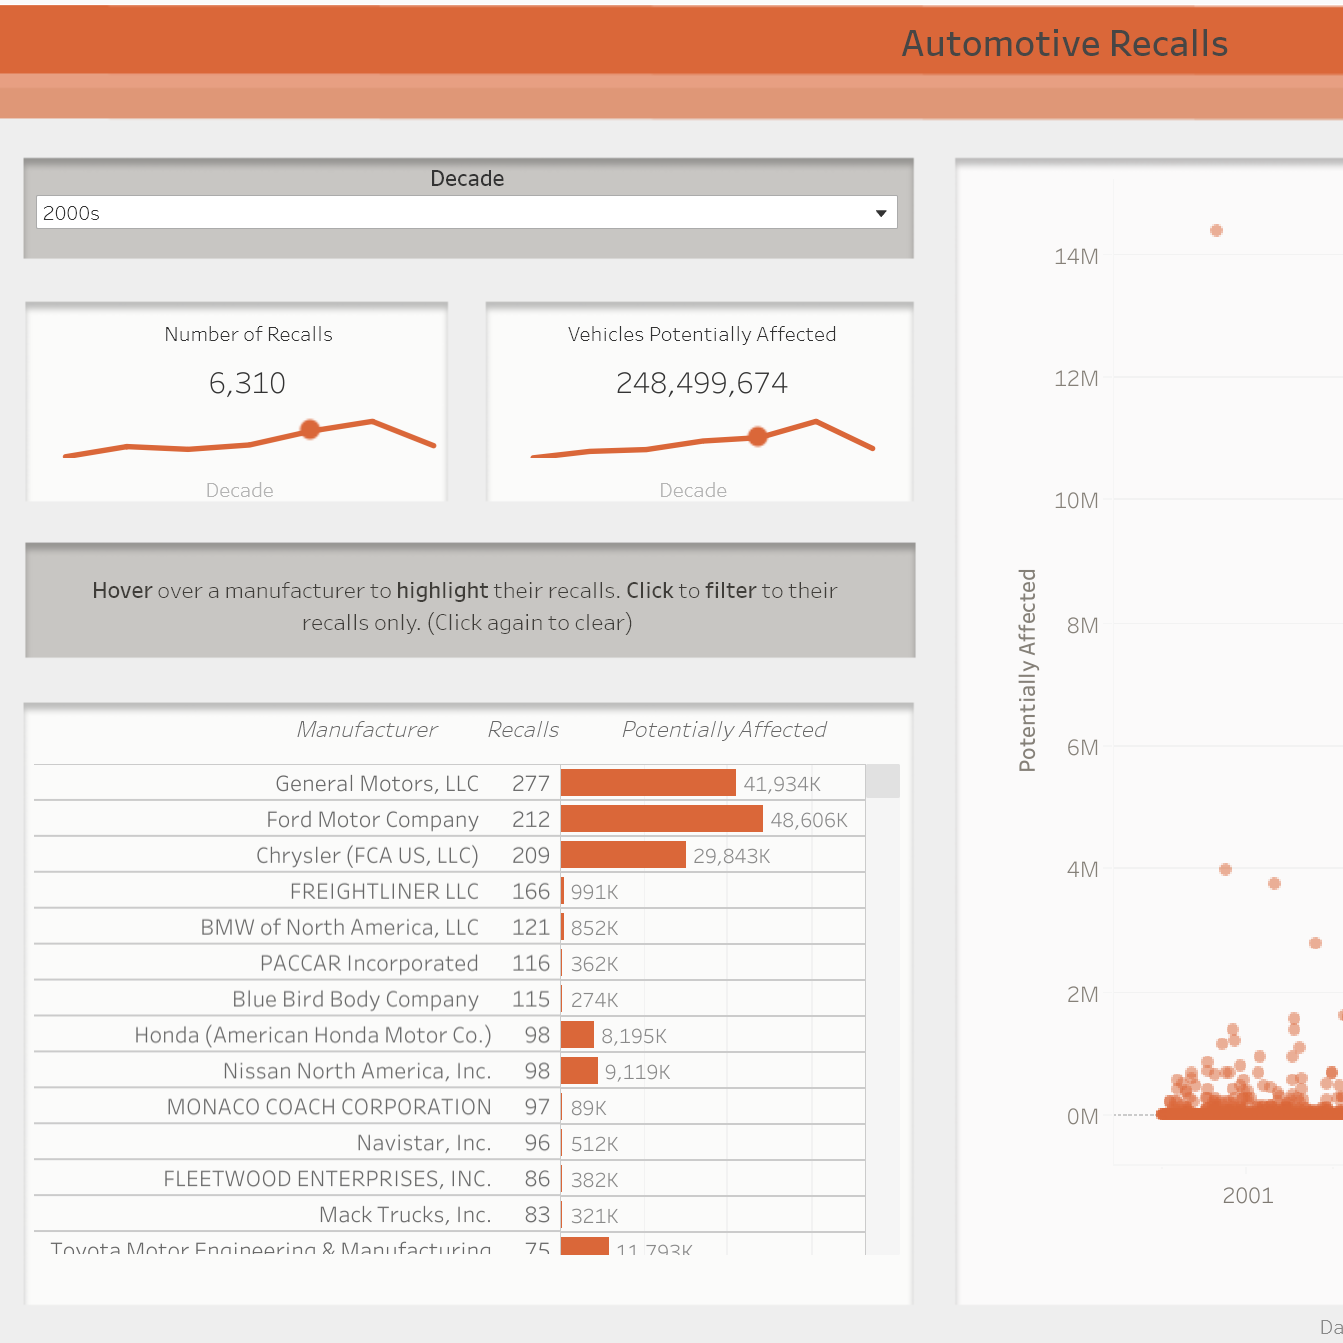
Auto Recalls
Continue reading
: Auto Recalls
Portfolio
January 25, 2023
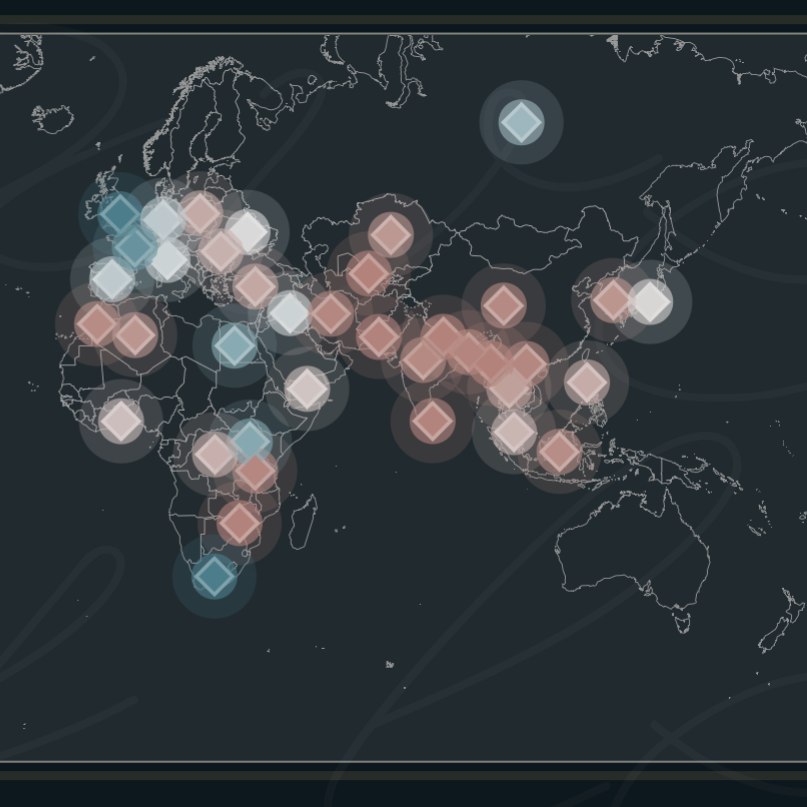
International Students
Continue reading
: International Students
Data Viz
,
Tableau
January 18, 2023
How to Make Donut Charts in Tableau
Continue reading
: How to Make Donut Charts in Tableau
Tableau
January 15, 2023
Level Up: Custom Tableau Color Palettes
Continue reading
: Level Up: Custom Tableau Color Palettes
Data Viz
,
Tableau
January 12, 2023
Level Up: Data Update Timestamp in Tableau
Continue reading
: Level Up: Data Update Timestamp in Tableau
Data Viz
,
Tableau
January 9, 2023
Level Up: Pop-Up Filter Boxes in Tableau
Continue reading
: Level Up: Pop-Up Filter Boxes in Tableau
Tableau
,
Uncategorized
January 6, 2023
Level Up: Custom Labels in Tableau
Continue reading
: Level Up: Custom Labels in Tableau
Portfolio
January 1, 2023
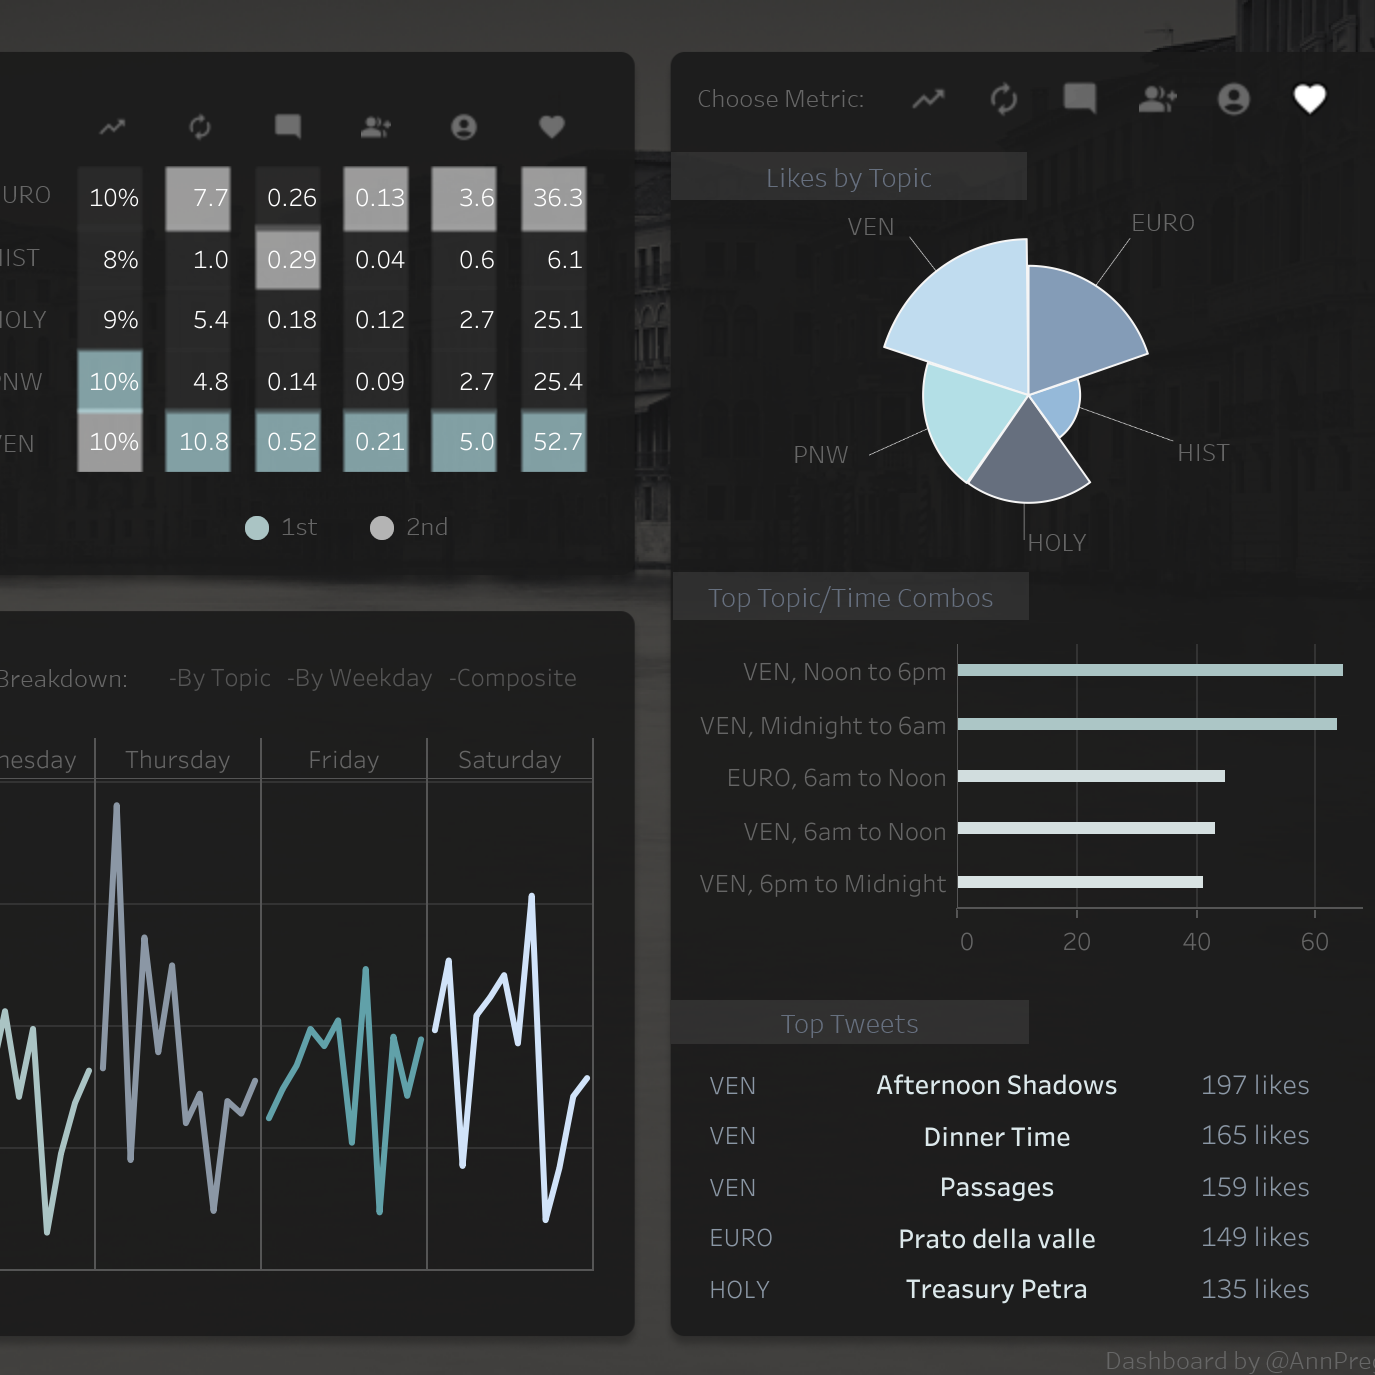
Twitter Metrics
Continue reading
: Twitter Metrics
1
2
Next Page
Notifications