Ann Pregler
Blog
Portfolio
Contact
K12
,
Portfolio
December 27, 2022
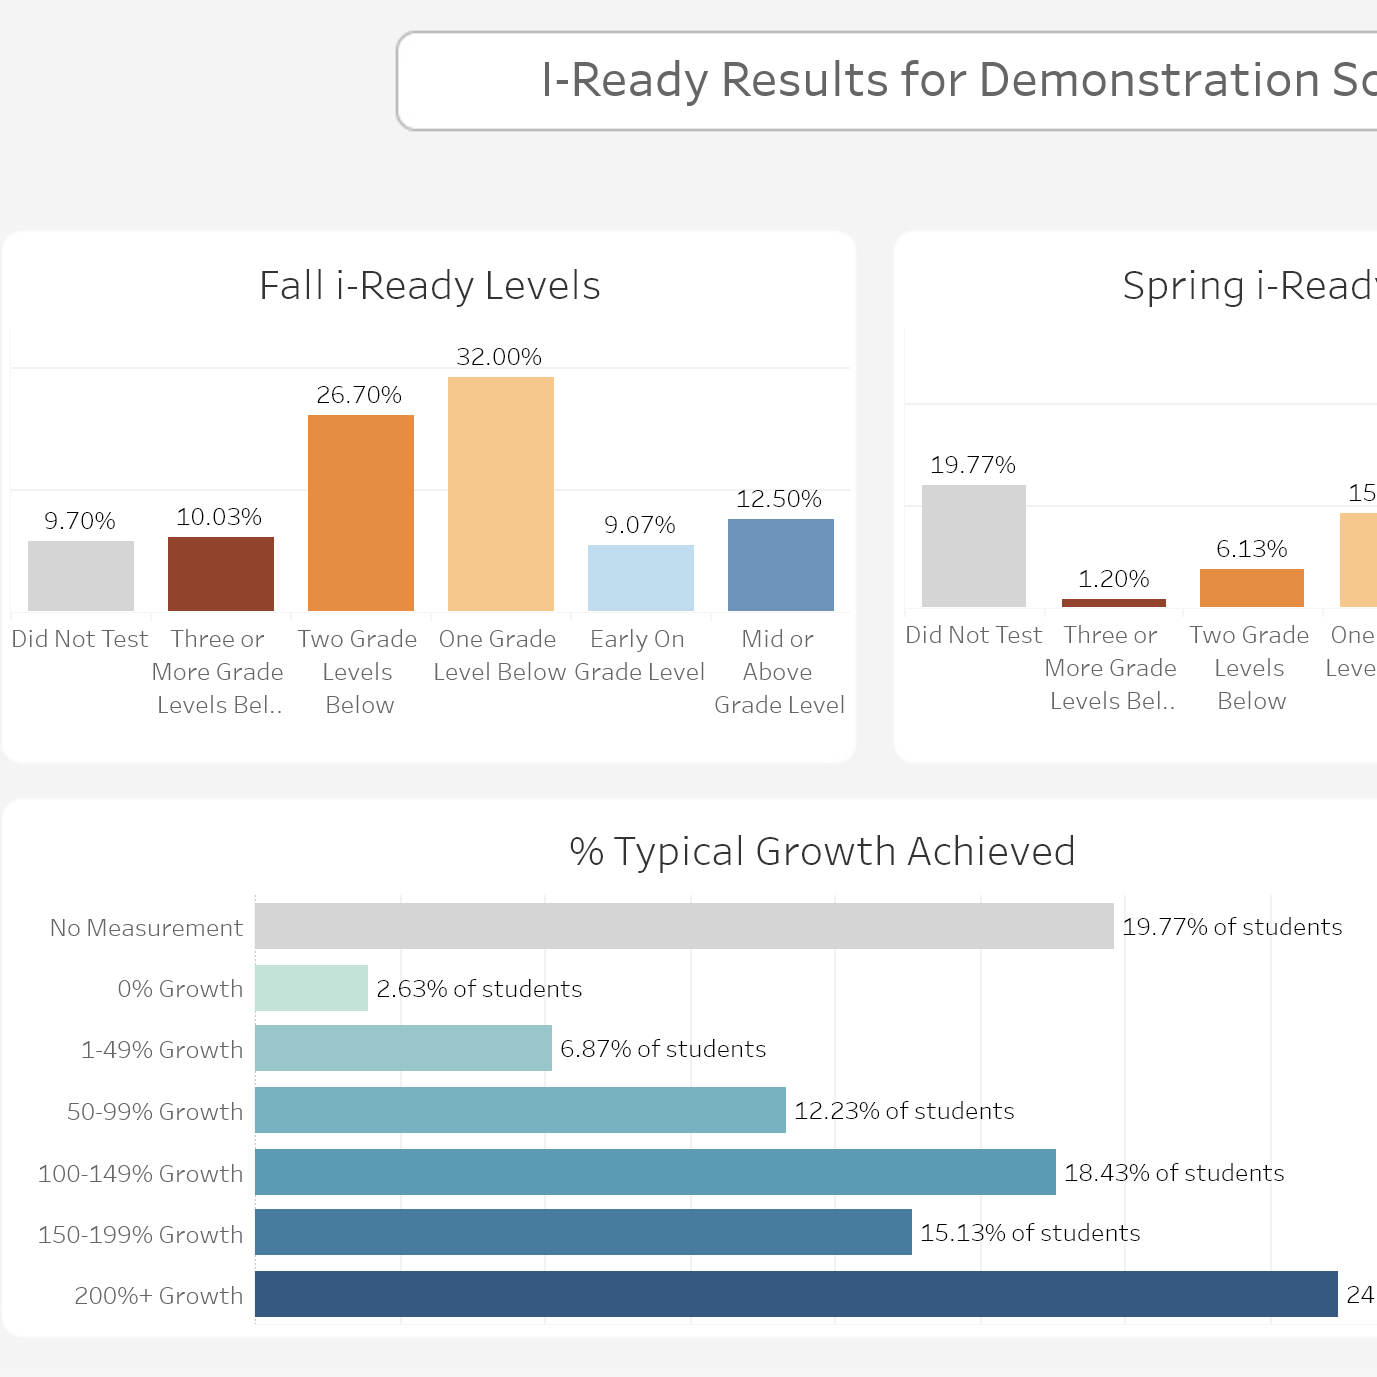
K12: Assessment Growth
Continue reading
: K12: Assessment Growth
K12
,
Portfolio
December 26, 2022
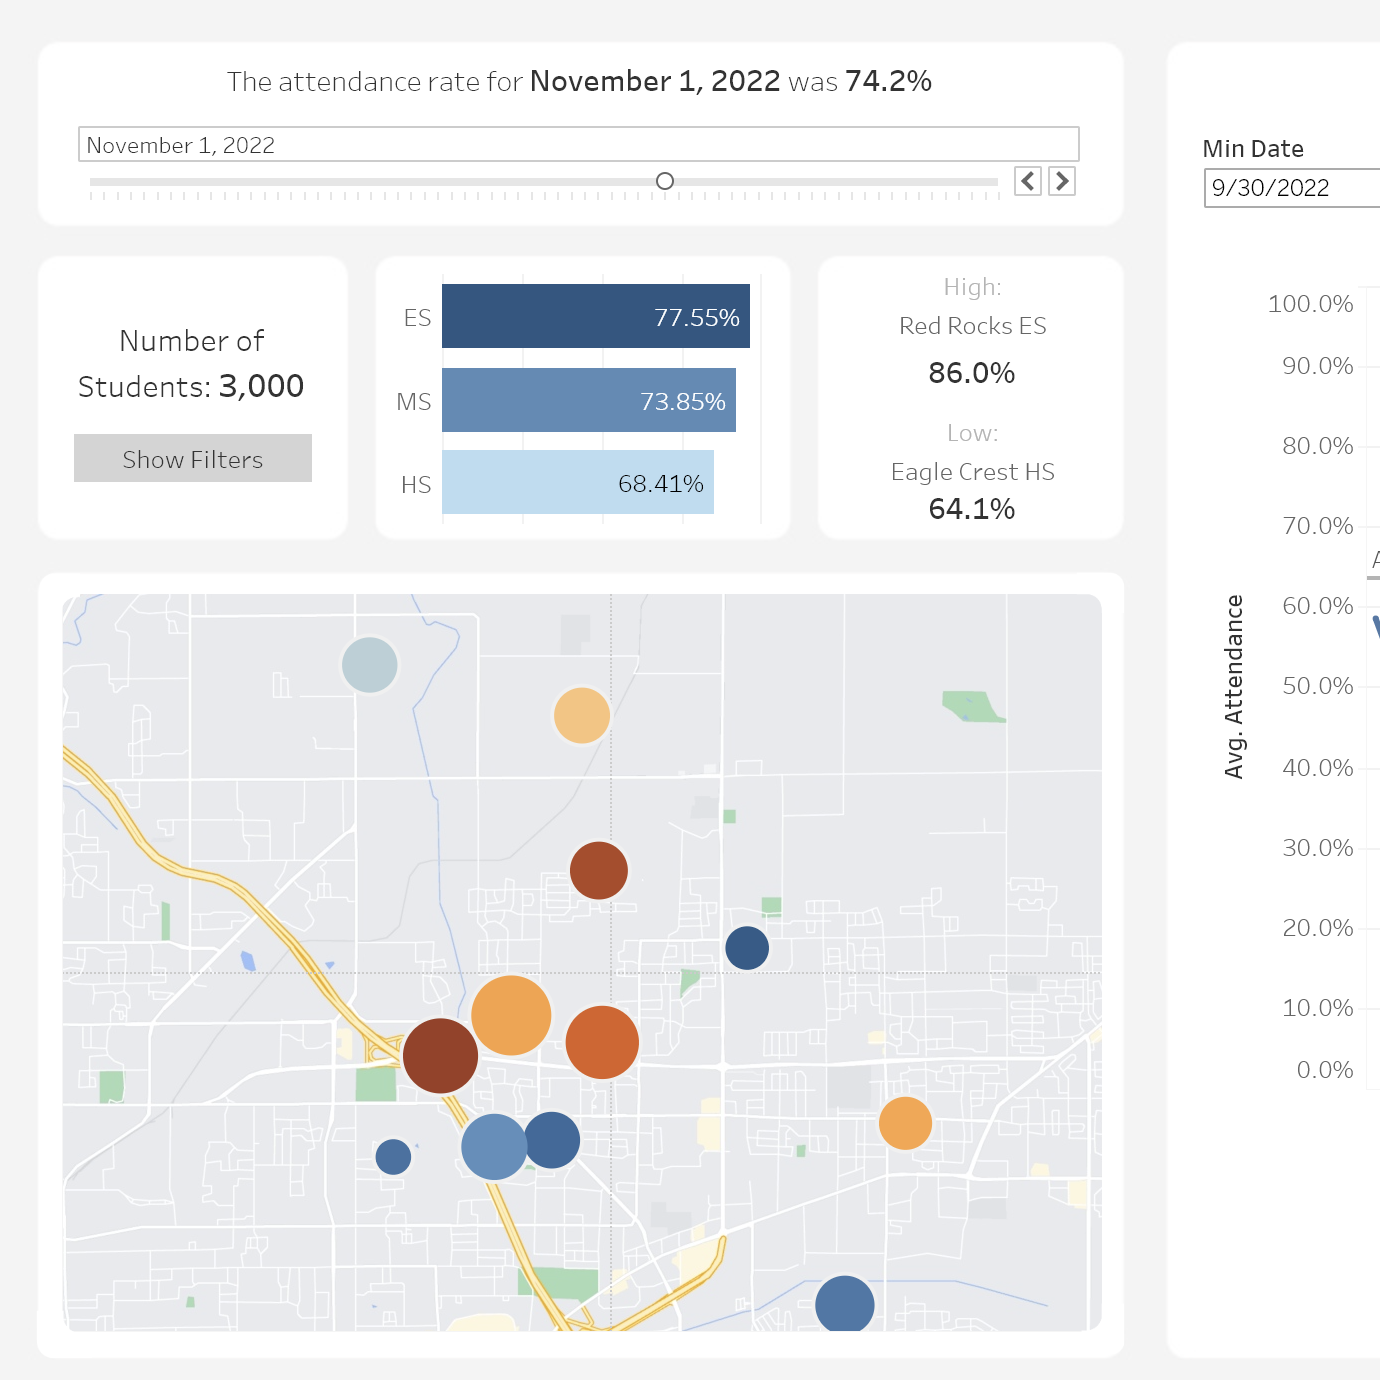
K12: Attendance
Continue reading
: K12: Attendance
K12
,
Tableau
December 26, 2022
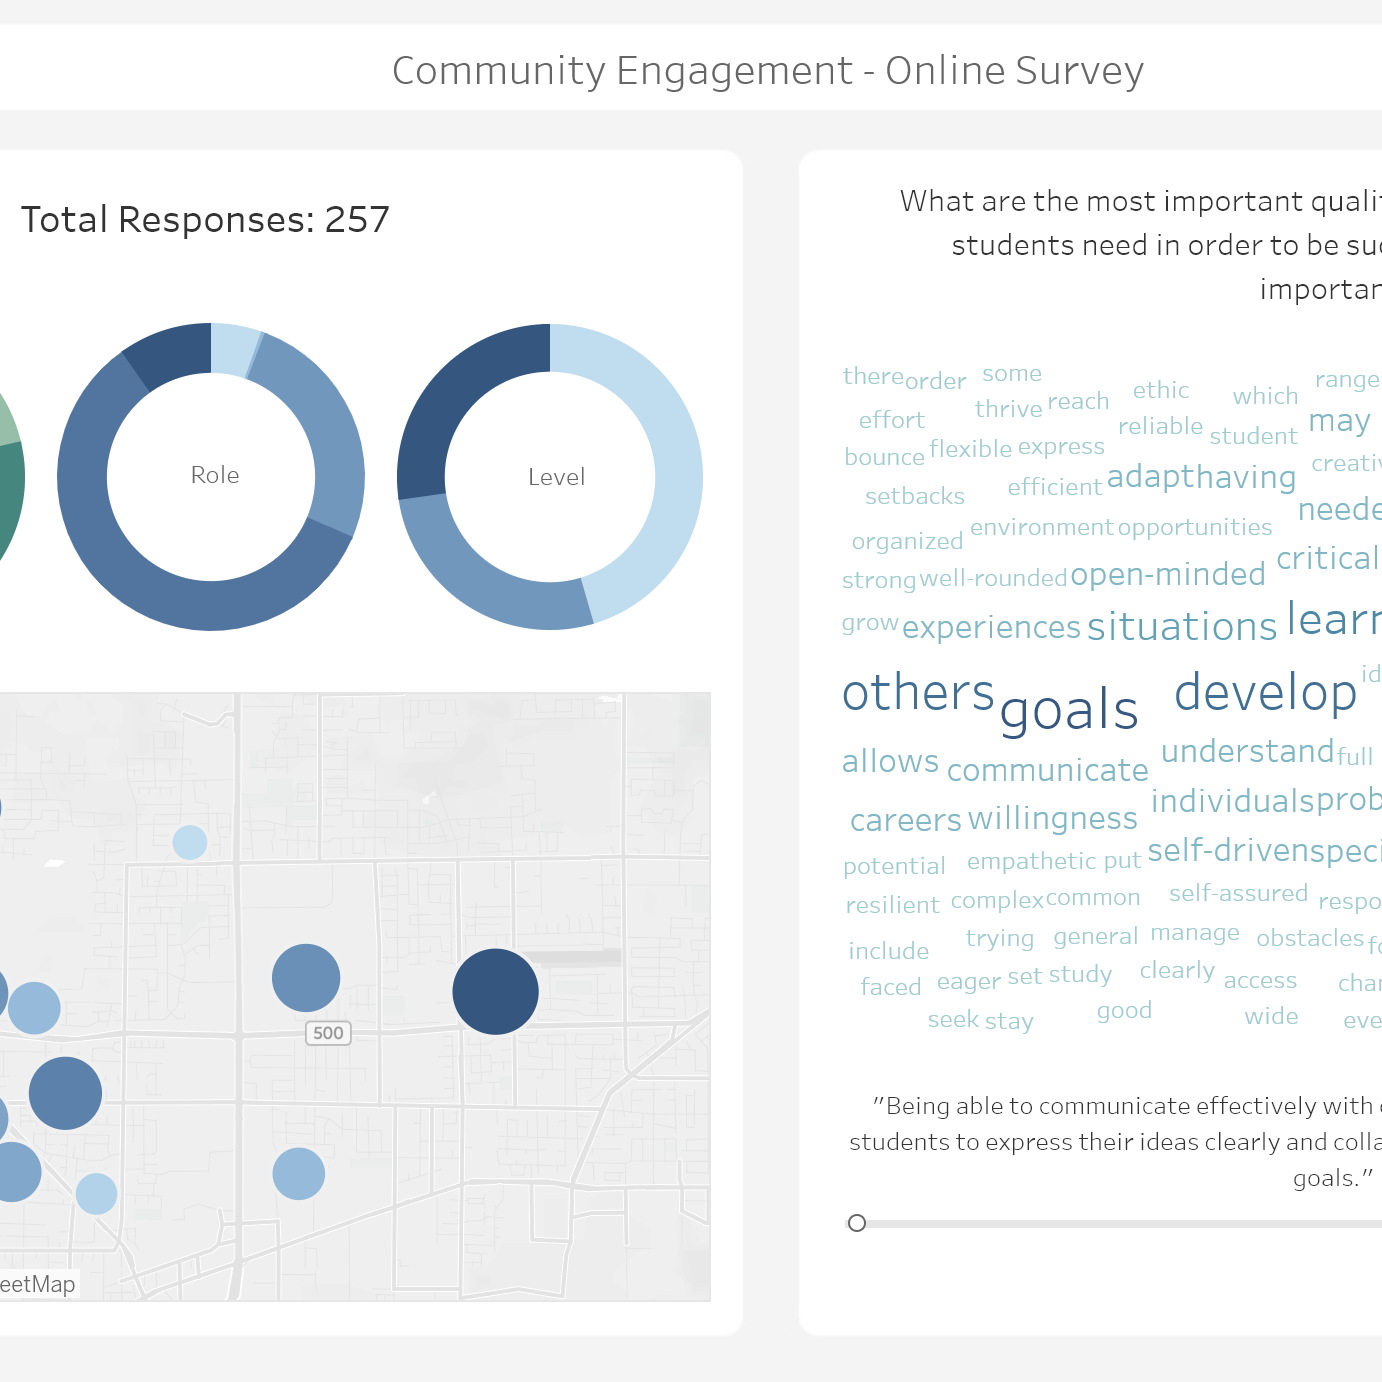
K12: Engagement Survey
Continue reading
: K12: Engagement Survey
Notifications