View on Tableau Public

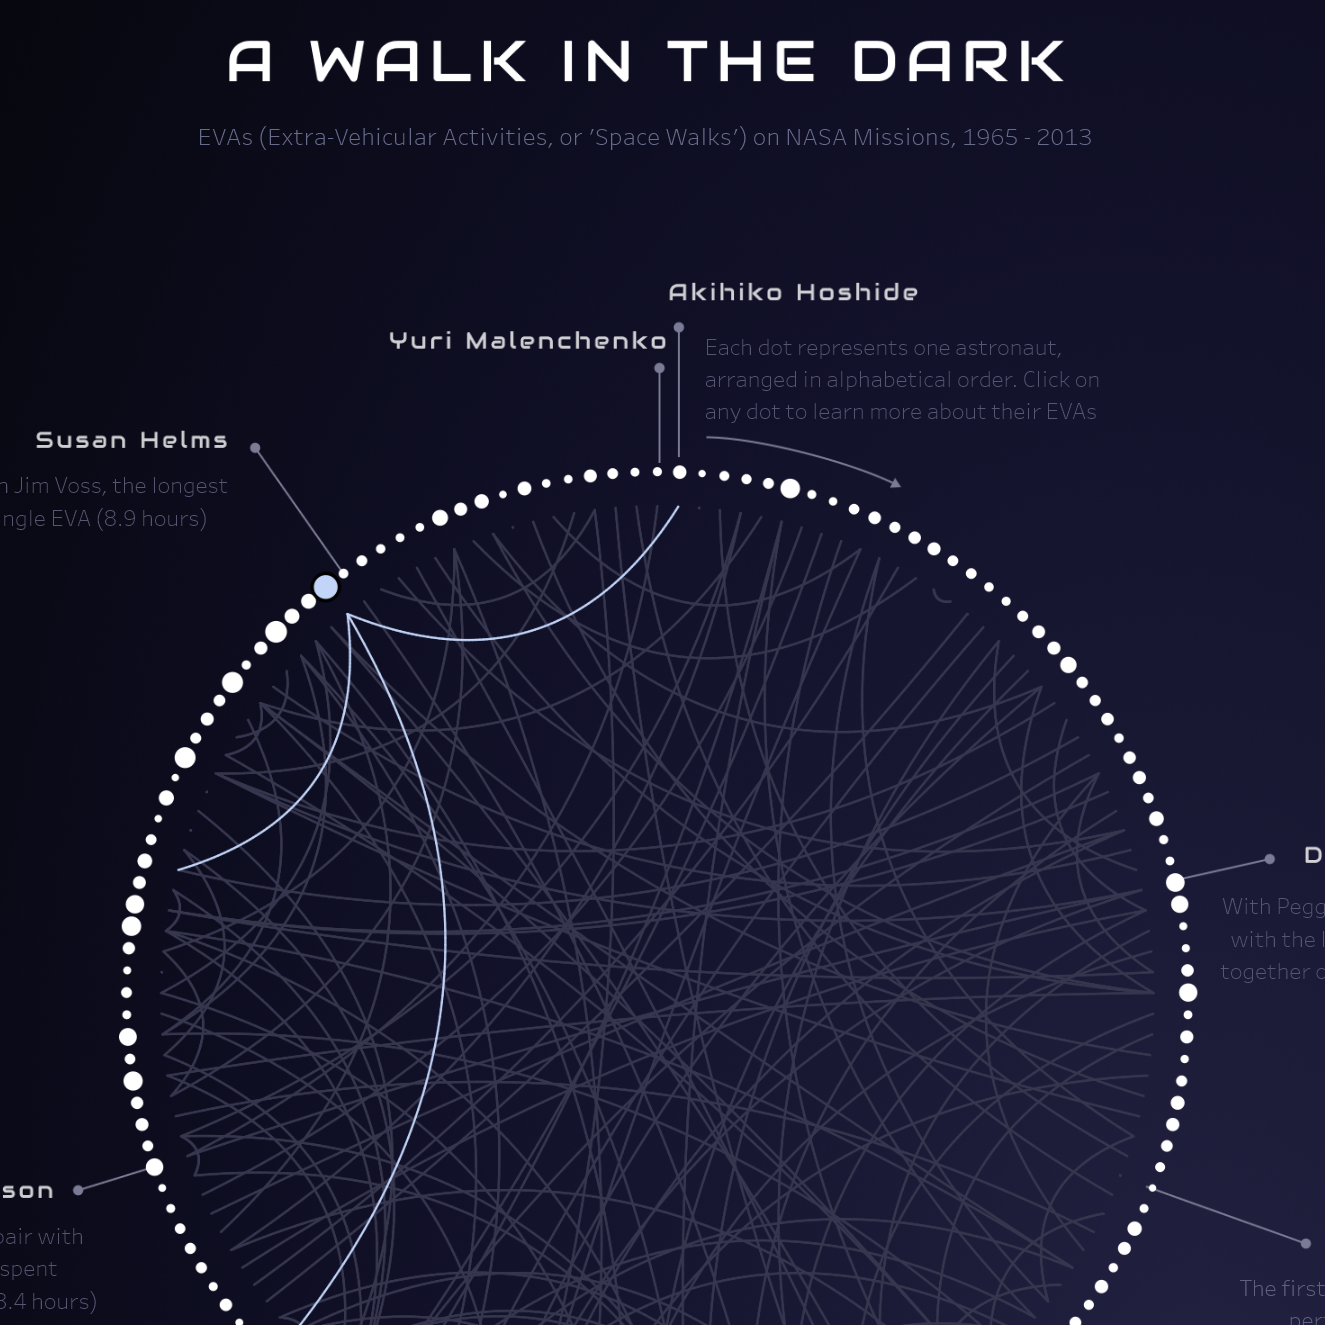
I created this visualization of NASA spacewalk data for the December 2022 Iron Quest community challenge. I tend to create a lot of practical visuals in my day-to-day work, as I mostly make dashboards for stakeholders, so I wanted to try something different with an aesthetic-focused visual.
Data source is from NASA.
Leave a Reply